 Possible Planets
How to forecast the climate—a practical guide to open models and data
When chosing a climate model for your project, it is important to consider the requirements for the data you want to produce, such as:
- What timescale and resolution to you want to simulate?
- How many emissions scenarios do you want to simulate?
- What level of complexity, and what output variables do you expect?
The purpose of this guide is to prepare you with enough knowledge to find or generate a climate forecast suited for your use, particularly if you are not familiar with climate science.
What is an earth system model?
Earth system models (ESMs) are computational models which calculate the behavior of the Earth’s natural systems over time. In climate science they are critical for determining climate sensitivity—the increase in temperature resulting from an increase of greenhouse gasses in the atmosphere.
ESMs do not try to predict how much greenhouse gasses will be emitted by society or society’s response to climate change—this is entering the realm of Integrated Assesment Models (IAMs). In an ESM, greenhouse gasses and other human factors are exogenous, i.e. unaffected by other inputs.
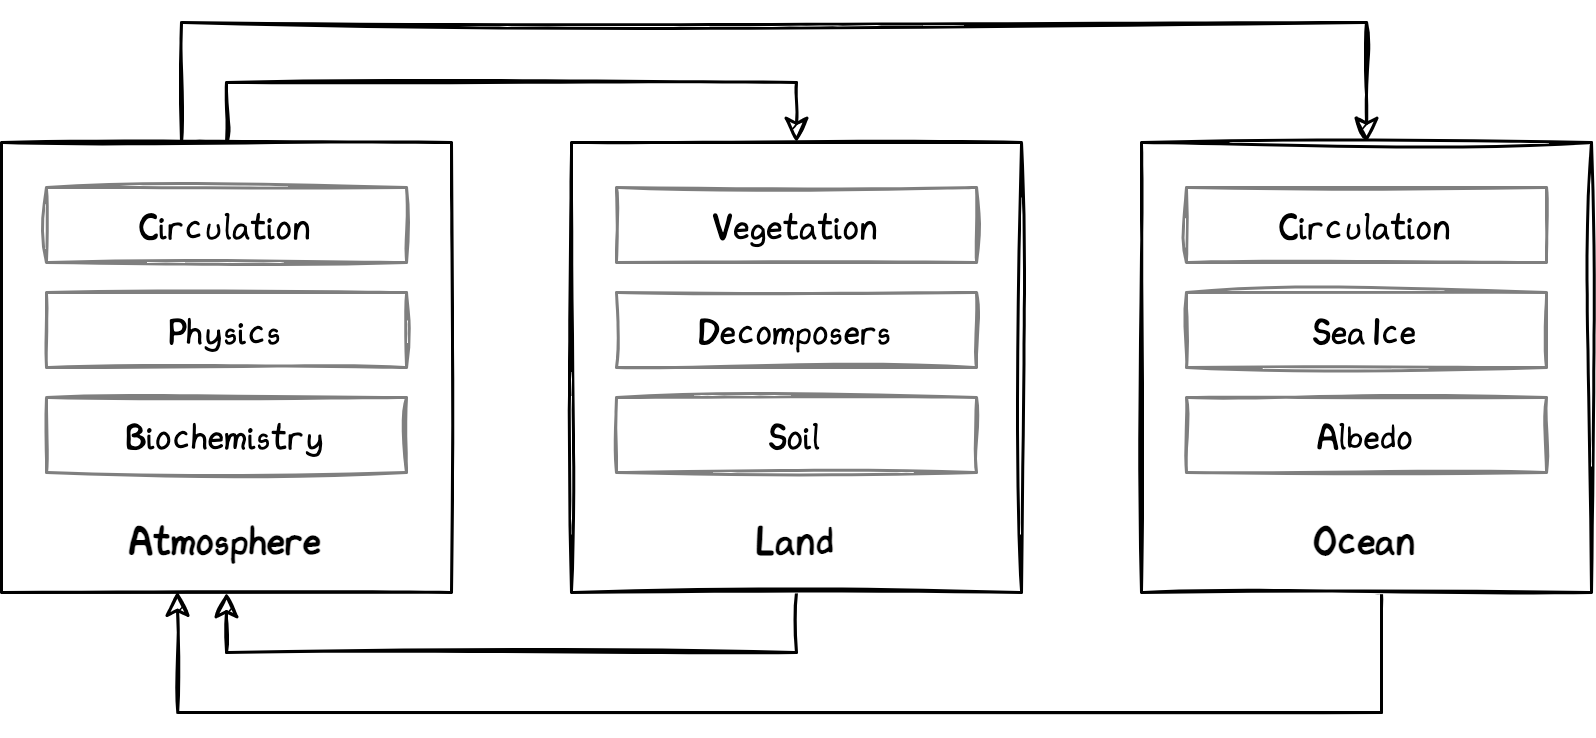
ESMs predict the response by simulating the five Earth systems—geosphere, biosphere, cryosphere, hydrosphere, and atmosphere—and the interactions between them such as the carbon cycle, heat transfer and moisture transfer.
The world of earth system models
Hundreds of ESMs exist, ranging from basic to highly complex. Furthermore, many models have sub-modules and variants. Below I will discuss full and reduced complexity models, two types of models which are both useful in their respective contexts, and are both frequently used to produce data relied on by the Intergovernmental Panel on Climate Change1 and national policy makers.
Full complexity models
The Coupled Model Intercomparison Project, which is the United Nations-sponsored initiative for comparing and evaluating climate models, lists 114 models from distinct research groups used in its research as of May, 2022. The CMIP “ensemble” of models is the de facto international standard for climate forecasting and is commonly made use of by in academic research averaging the results of some or all models in the ensemble. In this guide I will show you how to use access the data produced by these models, by using the freely available datastores on the internet. However, as these models are computationally demanding (and often closed-source anyways) running them for small research projects is normally infeasible.
Reduced complexity models
Reduced complexity climate models (RCMs) produce reasonable climate forecasts at a fraction of the computational cost of full complexity models. They are designed to be much simpler, yet ensured to be accurate by verifying their results against full complexity models. Because they are simpler, they also have the benefit that their code is easier to understand and audit. The Reduced Complexity Model Intercomparison Project lists 14 reduced complexity models as of October 2020.
How to access CMIP forecast data
CMIP6’s sub-project ScenarioMIP consists running about 60 full complexity models using eight pre-agreed upon emissions scenarios as input.2 Each of these scenarios, or “pathways”, can be thought of as a line depicting the concentration of CO2 in the atmosphere for from the start of the simulation until the year 2100. So “SSP1-1.9” is a pathway where the concentration of greenhouse gasses leads to 1.9 watts/meter2 of radiative forcing in 2100.
How CMIP output data is organized
ScenarioMIP data from model runs is divided by model, scenario, and output variable. They are further divided into time-range chunks deemed to be of reasonable filesize. Otherwise, each time-range contains a complete grid of altitude and geographic coordinate data. These files are delievered in the NetCDF format (an open file format for storing data arrays) with the .nc extension.
Online CMIP6 datastores
CMIP forecasts be downloaded directly from the internet without running any simulation. The most bare-bones solution might be to download from an online search tool and view using a tool such as NetCDF4excel. A much more robust solution would be to download, processing, and visualization CMIP data using Python. A list of free datastores and methods for using the CMIP data are listed below:
- Earth System Grid Federation
- Online data search tool to search for and download the original NetCDF data files
- REST search API and OPeNDAP server to search for and download datasets (Example code: Python)
- Google Cloud:
- Online interface to a cloud storage bucket of Zarr files, sorted hierarchically into folders
- API to search and download datasets from the Google Cloud Storage bucket (Example code: Python, Julia)
- C3S Climate Data Store
- Online data search tool to search for, crop, recombine, and download netCDF data files
- API client library for Python (Example code: Python)
- University of Melbourne
- Online visualization tool to search for, plot and download global average data
- REST API to search for and download global average data in .MAG file format
How to forecast data from an RCM
If you need more control over the model scenario (choosing a predefined CMIP emissions pathways is not an option) then you need to run a model simulation for your specific scenario. Most RCMs are both open source and cross-platform, meaning that you can run them yourself on a personal computer. Five of the most prominent RCMs and their means of use are listed below:
- OSCAR (A compact Earth system model), available as:
- The Hector Simple Climate Model, available as:
- C source code with an R interface
- a Python wrapper
- a web application
- FAIR (Finite Amplitude Impulse-Response simple climate-carbon-cycle model), available as:
- MAGICC (Model for the Assessment of Greenhouse Gas Induced Climate Change), available as:
- MCE (A minimal CMIP emulator), available as:
We are currently developing several introductory how-to guides for the above models. For the current list of guides check the table on “Models” page.